609 private links
- https://www.nytimes.com/2023/10/15/business/nigeria-fertilizer-shortage.html Behind paywall, inaccessible. Intro to the article here, what appears to be the full article here. Via chemjobber.
- https://www.poynter.org/reporting-editing/2022/world-food-supply-threatened-global-fertilizer-shortage/
African farmers on average use the least fertilizer per acre in the world and have some of the lowest yields, particularly for corn and other grains that provide the bulk of the continent’s calories. As a result, despite having 60 percent of the world’s arable land, almost half the countries in Africa depends on imported wheat from Russia and Ukraine, with 14 African countries getting more than half their wheat from the two warring nations.
- https://www.nationalgeographic.com/environment/article/global-food-crisis-looms-as-fertilizer-supplies-dwindle National Geographic, 2023-05-23
First farm in Kenya to produce fossil-free fertilizer (ammonia from renewably produced hydrogen), built by US startup firm Talus Renewables. Yale Environment 360 Magazine, 2023-10-11.
- https://www.businessinsider.com/fertilizer-shortage-is-at-the-heart-of-pending-food-crisis-2022-8 Business Insider, 2022-08-01
- https://nelhydrogen.com/press-release/awarded-iberdrola-contract-for-20-mw-green-fertilizer-project-in-spain/
- https://africafertilizer.org - slightly suspect website, but might contain useful data.
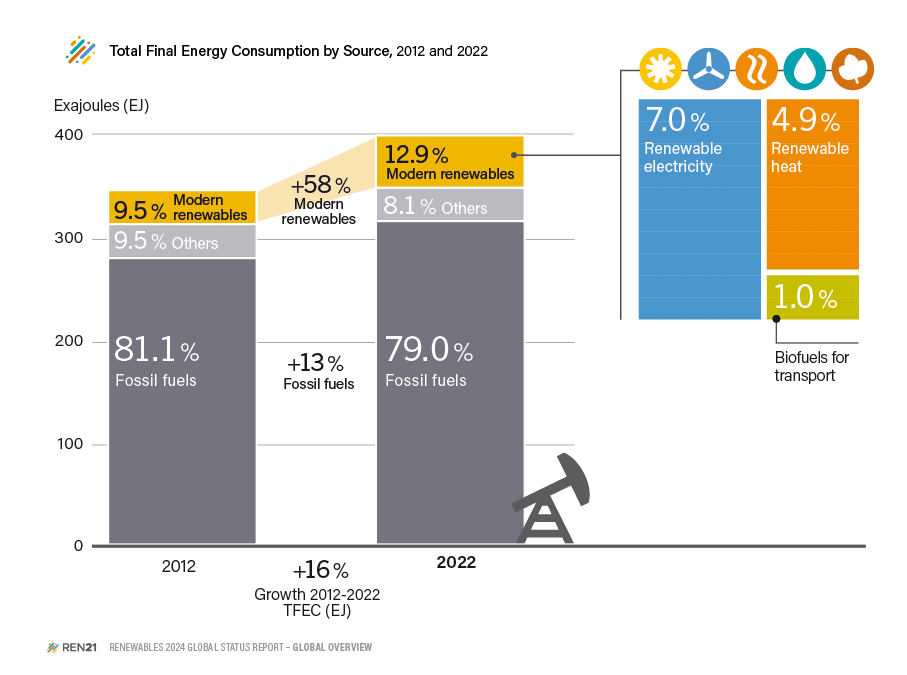
Renewable Capacity Statistics 2023 released by the International Renewable Energy Agency (IRENA) confirms upward trend of renewables against declining new fossil fuel capacity.
electricityMap is a live visualization of where your electricity comes from and how much CO2 was emitted to produce it.
The map is open source, and improves weekly thanks to 1700 contributors and counting.
The project has an informative FAQ, a list of its data sources, and a wiki.

Any reversible physical process is an energy storage technology.
An interesting take from Technology Connections.
In this one, he reminds us that simple management of heat in our homes can amount to a simple and immediately available method to distribute energy use from the hours of peak demand.
Crooked Timber says: "energy storage is a solvable problem [...] concerns about the variability of wind and solar power will come to nothing in the end".
Moving rocks up and down former mine shafts could be a workable energy storage system.
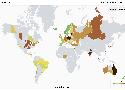
Wärtsilä has modelled 145 countries and regions to find the optimal way to produce electricity from 100% renewable energy sources. The map illustrates how the power system of each of these regions would look like if they were to be optimally built from scratch, not considering the burden of existing power plants.
Nicely done interactive map, and quite fun to explore.
The optimisations presented in this map were calculated using a proprietary tool, but carried out in collaboration between Wärtsilä and LUT University's solar research group under the direction of professor of solar economy Christian Breyer.
Not sure if the data itself is published anywhere. Don't know why several outlets label this map "open access". Interactive, yes, openly accessible on the web, yes, but by that measure most any website would count as "open access".
The optimal capacity and energy mix are defined using a power system optimisation tool Plexos, which is a commercially used software developed by Energy Exemplar. Technologies and their parameters (costs, efficiencies, technical lifetime etc.) and conditions of each region (renewable profiles, load profiles etc.) are given to the software, after which the optimisation algorithm calculates the mix of technologies which provide the lowest cost for each region, but can still manage to serve energy demand reliably every hour of the year. We have used representative region-specific renewable profiles. For reliability purposes the system in both scenarios has been designed to sustain up to three consecutive days of low renewable production.
It's interesting to see how the Wärtsilä PR department has clearly been spreading the word around. News of this Atlas via
- Energy Egypt
- Cyprus Shipping News
- Green Building Africa
- Africa Business
- PV Europe
- Power Info Today
- Global Energy World
News of the research agreement via